If, in this difficult, resource-strapped, and uncertain environment, you have just been hired, elected, nominated, or appointed to lead a large, complex organization of hundreds, thousands, or, in Barack Obama’s case, millions of people, you face considerable challenges. You must get up-to-speed very quickly, putting names to faces and matching those to responsibilities, become familiar with each of the sub-units and what their special missions are, and getting an overall feeling for the spirit and meaning of the whole organization. At the same time, you, as the one in charge, will certainly start thinking about how to improve things—by reducing expenses, improving performance, setting priorities (which also can mean considerable triage), and ultimately reorganizing.
It’s a truism to say that you don’t know what you can’t see. But, as we’ve seen in countless situations, the unseen can hurt you. This proves especially true when you reorganize, when you set out to deliberately change underlying organizational dynamics without clear views of what it is that you’re reorganizing.
Imagine that the standard mental model of organizations that most of us hold is actually wrong. Imagine that the quick cartoon in our heads of how organizations work is in fact an epidemic distortion of reality. If this is true, it’s no wonder that our large organizations don’t function very well, that bureaucracies rapidly grow out of control, and that frantic steering from the top seems to have so little effect.
We’ve spent most of this decade looking at, analyzing, and interpreting how our institutions actually are organized. We’re here to report that most of us hold a distorted view of organizations.
While people like to think the hierarchy is irrelevant, it is nevertheless unavoidable. If you doubt this, try to collect your paycheck without the hierarchy. Although many do in fact earn their living from networks, most people on earth are paid by formal structures.
Reorganization is particularly dangerous when blindness shrouds the real organizational design. Here, simple approaches, while laudable in many contexts, are sure to cause more harm than good. Take, for example, the recent report from a client: his company was going through a reorganization exercise prior to layoffs. In the new design, every manager would have approximately ten people on staff—regardless of function, level, or experience. Ten people per manager. Before smashing the hierarchy and/or issuing such one-size-fits-all reorganization edicts, we encourage you to look at the realities of your own organization.
Three Myths, Three Realities
Based on our extensive research with Royal Dutch Shell, the original sponsor of our organizational mapping and analysis work, and in smaller pilots with other commercial and military organizations, we have uncovered three common beliefs about hierarchy. We’ve found them all to be false. Given our initial analysis of the top-level of the executive branch of the US government, which we report below, we’re prepared to say that the same faulty thinking applies to the government as well.
These myths, vestiges of mechanistic thinking, are widely held:
Myth #1: Hierarchies are shaped like pyramids.
Myth #2: Most managers have roughly the same average reporting spans; and
Myth #3: Executives at the same level run organizations of roughly the same size.
Our studies suggest three different realities, characteristics more indicative of organic, living systems.
Reality #1: Hierarchies are shaped like diamonds, wide in the middle, narrow at both ends. Picture a bell curve turned on its side.
Reality #2: Manager spans are not average. They vary widely with many managers directing quite small teams with only a few people reporting directly to them while a few manage large teams with many reporting to them.
Reality #3: The size of most internal sub-organizations is small, regardless of where they sit in the hierarchy. And, there are a few large organizations that show up at nearly all levels, not just at the top.
Why do these myths and realities matter? Because the current conventional wisdom about reorganization—that “flatter is better”—is overly simplistic. Combined with the view that hierarchies always take the shape of diamonds, organizations are prone to centralize and regularize, to reactively remove managers and levels. Unfortunately, this impetus addresses only one aspect of organization dynamics: better control and internal communication. The need for more detailed decision-making, for smarter responses to greater complexity, does not factor into this change equation.
Calls for greater complexity rarely accompany demands for more simplicity.
Ironically, the compelling need to accommodate complexity itself has led to the breakdown of old industrial organizational models. Complexity breakdowns drive the need to reorganize. Hence, blunt “flattening” may actually aggravate the original problem, reducing the organization’s ability to handle the very complexity that demanded it to change. Instead, the ability to deliver not-so-good decisions improves significantly.
Single-dimension approaches drive organizations faster to disaster.
Without knowing any better, we seek an “ideal” flat regular hierarchy, attempt to avoid “worse” cases of deep, detailed bureaucracies, and settle for something in the middle, an organization that is “the best we can do.”
We believe we can significantly improve our ability to collaborate in large-scale structures. Given the state of the world, we must truly do “the best we can” to develop the smart 21st-century networked organizations we so desperately need.
Analyzing the US Government Hierarchy
For most casual observers of government, knowing who will hold the new positions in the Obama administration is enough. However, for those who really what to know what those stepping into these posts are up against, and for those people themselves, it’s advisable to look deeper, to understand the true structure of our government—and whether its design is fit for purpose.
As a public service, we have started this investigation. Using publicly available org charts, we’ve mapped the top-level of the US government, using the existing administration’s diagrams. We’ve then analyzed the management burden of the structures the Obama-administration appointees are stepping into—before they take it upon themselves to reorganize.
What we’ve found is this: there are a certain number of particularly complex positions in the senior ranks of government. These “hub positions” have very high numbers of people reporting directly to them, which puts intense communication and coordination demands on the incoming office-holders. In essence, these second-in-commands in their agencies hold the entire senior executive structure of government together.
Why is it so important to identify these hubs? Network science answers this question. From study of networks in many arenas—from the Internet to the spread of disease to the array of Hollywood actors, researchers have found that such hubs are vital “nodes,” centers of gravity that hold the whole complex together. Hubs provide the network with adaptability and offer robustness against accidents. These key switch points are also junctures of greatest vulnerability and catastrophic failure. Take out a few hubs, whether by accident, inattention, or attack, and you can bring down the whole network.
Preliminary Analysis of Senior Government Hierarchy
 We
draw our conclusions from some very basic data.
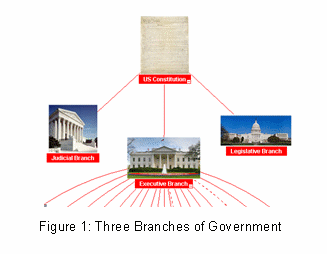
To establish an overall chart of the government, we must first plant the root node: the Constitution, which stands for the whole US government. This whole then splits into three parts—the judicial, executive, and legislative branches. The root node for the executive branch is the president.
Stitched-together, the org charts of top levels of the US government yield a simple tree of 715 nodes (positions) and links (reporting relationships). From this, we can make some basic statements related to the number of people reporting directly to a manager, in organization-speak, its span. In the terms of network science, the span is analogous to a very basic metric known as the node’s “degree.” Sorting positions by their spans identifies a small number of high-span positions in the hierarchy.
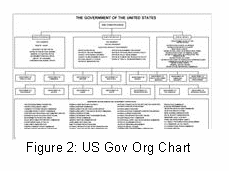 We
obtained the data for each part of the executive branch from each
department’s web site, usually found in the “About”
section. These cabinet-level
org charts are collected together and arrayed under
the official constitution-level
org chart from the US
Government Manual (you may peruse our thumbnail
catalog of all charts).
In our “US Gov Network Map,” we link the “Independent Establishments and Government Corporations” that float at the bottom of the executive branch to the president via group membership links. In truth, the statutory relationship between independent agencies and the president varies widely. Thus, we do not include them in this analysis. We have also not (yet) included the Executive Office of the President because the announcements of people and titles give only partial information about how these positions hook together. For example, we cannot tell how the dual deputy chiefs of staff, Mona Sutphen and Jim Messina, will split the load of what had been a single position. We also assume that once Obama takes office, the entire Executive Office will undergo significant reorganization.
As we state in the introduction to this piece, our preliminary findings indicate that there are key hubs in the formal federal hierarchy. This finding is in line with the cutting-edge results of network science, evidence that there are “scale-free” networks throughout nature, in physical, biological, and human systems. What scale-free means is that in natural networks there is no average node; rather there are many low-connection nodes and a few nodes virtually off the chart in terms of associated links. Human organizations appear to be natural scale-free networks, not pyramidal machines.
How did we find the government’s “hubs in the hierarchy?” We mapped it as a network and then used simple tools to analyze it.
Government is large and complicated, but like any enterprise—public or private—it can be mapped as a network of nodes (positions) and links (reporting relationships). This method enables us to visualize, navigate, and analyze the whole government as a single network of interdependent people-in-positions.
These charts include the government’s senior management positions comprising: US cabinet secretaries; the deputy, under, and assistant secretaries; the major agency directors; the senior positions in the Executive Office of the President; and the independent agencies. For the most part, these are the key political positions that have fresh faces in the 2009 transition of government.
Having mapped the positions, we then are able to analyze the hierarchy as a network. Analysis provides a set of management metrics that relate to positions, not to the people occupying them. While traditional HR evaluates people on the basis of their performance, network science allows us to evaluate the positions they hold, based on their relative network metrics, their relationships and roles within the whole configuration of jobs. Of course, the map of the hierarchy is just the first that we can chart, albeit, the most basic one—and the one out of which those all-important paychecks are cut.
Naming the Hubs
Who are these hubs in the org charts? In the administration about to pass from power, they are the deputy secretaries of Labor, Homeland Security, Health and Human Services, Transportation and the Deputy Attorney General. As things stand at the end of 2008, there are 28 people reporting directly to the Deputy Secretary of Labor, 27 to those holding the next three posts, and 26 to the last. See Table 1 for the list.
-
Level
Span
Position
Department
3
28
Deputy Secretary of Labor
Labor
3
27
Deputy Secretary of Homeland Security
Homeland Security
3
27
Deputy Secretary of Health and Human Services
Health & Human Services
3
27
Deputy Secretary of Transportation
Transportation
3
26
Deputy Attorney General
Justice
3
21
Deputy Secretary of Energy
Energy
3
20
Deputy Secretary of State
State
3
19
Deputy Secretary of Treasury
Treasury
4
19
Chief of Staff to/or the Secretary of Defense
Defense
3
18
Deputy Secretary Housing & Urban Development
Housing & Urban Development
3
17
Deputy Secretary of Veterans Affairs
Veterans Affairs
3
16
Deputy Secretary of Agriculture
Agriculture
4
16
Chairman Joint Chiefs of Staff
Defense
2
15
Secretary of Education
Education
3
15
Deputy Secretary of Defense
Defense
4
14
Chief of Staff
Commerce
4
13
Associate Attorney General
Justice
Table 1: Reporting spans in Bush administration
In this list, most hubs are deputy secretaries or their equivalent; only one department head, the Secretary of Education, has anything like the large number of direct reports that the deputy secretaries do.
What does this picture tell us about how government functions? If we regard the department secretary as the CEO, we can see the deputies as chief operating officers. As the CEO, the secretary focuses out while the deputies focus in. This Janus-like arrangement usually gives the deputies very large spans and the secretaries quite small ones. As we imply above, these “level 3” positions, by virtue of being two steps to the president, hold the senior levels of government together.
That deputies have large numbers of people reporting to them is not news to people familiar with government structure. Indeed, these key players comprise the President’s Management Council, a coordinating body set up by President Clinton as one outcome of his Reinventing Government effort (where we played a minor consulting role). Deputies are easy-to-see lynchpin positions at the top of the federal hierarchy network. And, because they are visible, they generally get good support from their organizations, with sufficient administrative, human resources, and IT services to make their jobs doable.
What is less visible is the likelihood that this pattern repeats itself throughout the vast federal hierarchy. Having studied a number of similar reporting structures in the commercial arena, we’ve found hubs at every level—and particularly in the middle levels of these organizations. If the government structure mimics the commercial one, these sub-senior hub positions exist there too. In hierarchies we’ve studied, 15-20% of all positions are managers, and roughly 20% of those are major or minor hubs. In other words, a mere 3-4% of employees may hold the whole federal hierarchy of millions of people together. Again, if they’re anything like their commercial counterparts, these lower-level hubs are likely to be under-supported, over-worked, and little recognized—which leads to poor organizational performance and even to catastrophic results.
 What
do we gain from identifying the key hubs in the hierarchy? First, the
quality and speed of internal communication improves when we can
pinpoint who’s in touch with the whole organization. Second, it
reduces the very substantial risk of failure for these positions.
Pressure on hubs becomes particularly intense in periods of
downsizing and restructuring, i.e. now. Remaining ignorant of who the
hubs are and the special qualities of leadership required in those
positions are points of great risk—and of great
potential—during periods of reorganization.
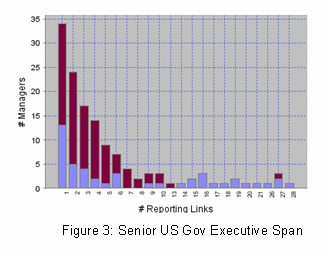
As we mention in our myths above, a core, unexamined belief about organizations is that most managers have an “average” span centered around a normal distribution of number of direct reports. In this data set, there are 135 management positions and 580 “staff” at the lowest level of these charts (NB: some of these nodes represent tremendously powerful positions, such as the FBI Director). An “average” span of 5.3 direct reports, which we arrive at by dividing the total positions by the total number of managers, is not a typical span—there simply isn’t one in scale-free networks (see Figure 3).
 In
the senior ranks of the federal hierarchy, more than half—56%—of
executives have no more than three people reporting to them. Less
than a third of the managers have between four and nine staff
reporting to them, analogous to what we conventionally think of as a
“normal” management span. A surprising 16% of senior
federal executives have between 10 and 28 people reporting to them.
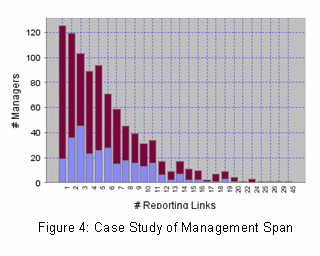
These numbers are similar to results we’ve found analyzing other large organizations. Our most extensively studied case of a 5000-position, nine-level multi-national business unit of a global enterprise produces results such as those illustrated in Figure 4.
Thus, we’re prepared to say that “hubs in the hierarchy” are not peculiar to government.
The Diamond in the Hierarchy
In organizations, levels are the big steps, the connective tissue between reporting relationships, and the trail from you to your boss to his or her boss all the way up to the top boss. In hierarchical networks, the top boss is, as we said earlier, the “root” node, the base of the tree. In network language, levels are the path of links between nodes and their roots. A path length is often called the “degree of separation,” how many links separate two nodes.
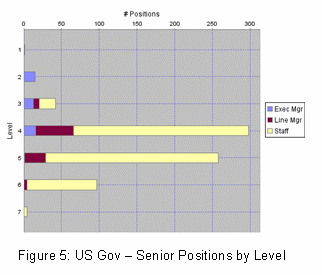 In
our group of departmental hierarchies, positions go from the
President’s Level 1 to Level 7 where, for example, the DARPA
director sits (the Defense Advanced Research Projects Agency, whence
cometh the Internet). Thus, there are six degrees of separation between the President and the DARPA director, ironically the same
putative count of social connections it takes to link any two people
on the planet.
Another unexamined myth about hierarchies is that when you array all the positions by level, they form pyramids. Traditionally, we think of hierarchies as small at the top and big at the bottom, a structure built for control. So if you analyze a large hierarchy, you would expect to see a slope from Level 1, at the top, to Level n, at the bottom. Instead, in the multi-position hierarchies we have analyzed, we see a more normal curve, with the bulk of positions in the middle levels. Most of the senior positions in this set of government are at Level 4, the people who report to the deputies (who report to the secretaries who report to the president). The graph of positions by level (see Figure 5) produces a pattern similar to those we’ve found in more complete structures that we’ve had the opportunity to analyze: it’s a diamond, not a pyramid.
 The
reason that large structures produce a diamond with the center of
gravity in the middle levels is because of the unequal size of the
component organizations sitting at the most senior table of
executives. A typical CEO might have ten people on staff representing
all the major functions of the enterprise. Of those functions, only
two or three will employ large numbers of people—engineering
and production in manufacturing, for example—while the other
seven or eight functions employ a much smaller proportion of the
overall headcount.
At the formal top table led by the president sit the Level 2 positions: vice president, the cabinet secretaries, other cabinet-level positions like the UN Ambassador, and the chief of staff. In our map of the top of government, three org charts are particularly large—Defense, Treasury, and HUD. In the case of Defense, the largeness of the chart reflects the largeness of the organization, but the other two cases are not the next largest departments. However, the different sizes of the org charts create the size impact on this data set.
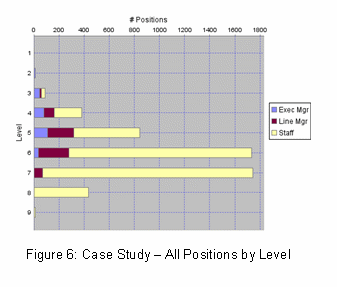
The level structure generated by our “US Gov” data set is similar to that produced by our case study of a complete organization mentioned earlier (see Figure 6).
Why is the shape of the whole organization important? Because the image forms basic assumptions about the structure of power, particularly the framework of “top-down” and “bottom-up” relationships. Staff at the end of management chains, people who directly do the work and don’t have anyone reporting to them, comprise 80-85% of a typical enterprise. These terminal positions are found at all levels, not at some imagined “bottom.” For example, a senior advisor to a chief executive is a Level 2 staffer. The diamond pattern suggests an “edge-in” and “center-out” flow of decision-making and communication between staff and management.
In practical terms, knowledge of the whole management structure by level and reporting span enables a powerful internal communications capability, one that replaces the ineffective and inefficient top-down cascade of purpose, strategy, and policy. By communicating directly to the small number of managers—hub executives and supervisors at every level, the top executive can reach most of the organization within two or three links rather through multiple transmissions famous for garbling messages along lengthy hierarchical communication chains.
This, in a nutshell, is how hierarchies can transform into networked organizations without destroying the physical structure of the bureaucratic classification and accountability system. The specialized boxes of bureaucracy are not themselves the problem with hierarchy, but rather the limitations and inflexibility of simple reporting relationships.
It’s no secret that hierarchy-bureaucracy, “the system,” frustrates everyone from “top” to “bottom.” But, everyone is quite literally “part of the problem,” part of the very structures that frustrate them. Today, enabled by ubiquitous interactive media, everyone can be part of the solution—which is to just add links.
