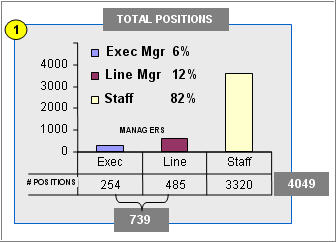
1. % of leadersWhat % of your people are leaders? Executive leaders? Who has the greatest management burden? Here, 18% of the employees are leaders, but as Measure 4 shows, their management loads are not distributed equally. Executive leaders lead other leaders, including line leaders, who have only staff reporting to them. |
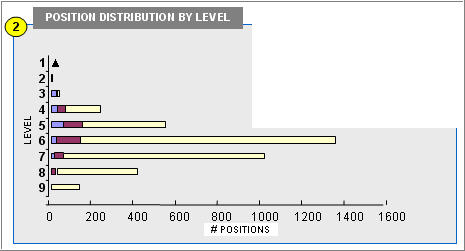
2. Distribution by LevelMost positions in this organization (nine levels deep) are in the middle levels. How many levels do you have? Which level has the most people? Which level receives the greatest executive attention? |
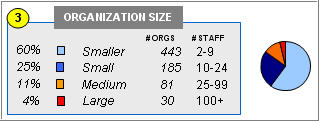
3. Size of OrganizationsDo you have sub-organizations that are very big but many levels down? Sub-organizations here are generally small, but 15% have 25 or more people in them: 4% have more than 100 people. |
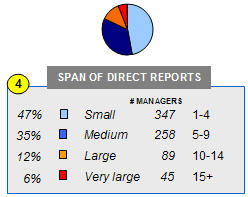
4a. Manager SpanFour out of five leaders here have fewer than 10 people repoprting to them. However, some 6% of all leaders, have 15 or more reporting to them. Are your reporting spans higher? Lower? What happens to these higher span leaders during performance reviews? |
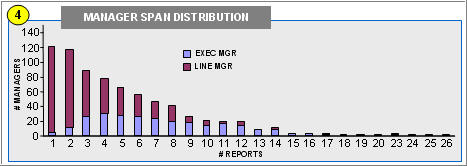
4b. Distribution of SpansNearly 1 in 5 leaders has 10 or more direct reports. These "hubs" include "super hubs," 45 people with 15 or more reports. What happens to them during performance reviews. |
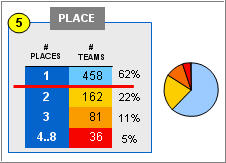
5. Location of TeamsEven in this time of highly distributed companies, most (62%) management teams here are collocated but many (38%) are not. How many locations are your direct reports in? Are some teams very spread out? |
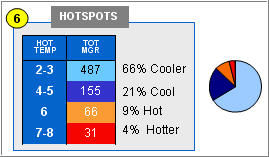
6. HotspotsSome positions are, by measures of sub-organizational size, span, and physical distribution, are more complex than the rest. Can you identify your hotspot positions? |
Six measures of our 4000-person demo organization chart shows how business intelligence is already embedded in a company's enterprise data system. How does your organization measure up?