A Combined Metric Identifies the Hotspot Positions
Hotspot Criteria
Each metric (1-5) gives us a different picture of a position’s place in the larger scheme of things. They can be used separately or combined to generate a relative index of management difficulty. This method is, of course, only one way to collapse all the separate metrics that have been generated into one “notice me” number.
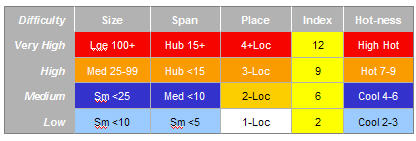
We generate a ‘Hotspot Index’ from three measures – size of organisation, direct reporting span, and number of places. Each component measure has been grouped into one of four categories representing grades of management difficulty from low (1), medium (2), high (3), to very high (4).
Where a team is collocated, we give it the a place value of zero and paint it no color, since it represents no change from the traditional team situation. Teams with two or more sites, however, are given hot colors to indicate the step difference between collocation (1-site) and virtual teams (2+-site teams).
These categories with their breakpoints are representative
and drawn based on our experience
Most leaders manage a small collocated group, but some handle large orgs with large spans in multiple locations.
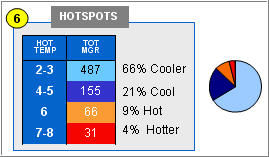
About 20% of the positions (based on proportions of actual data) are hotspots by our measures, exemplifying the “80/20” rule that seems to prevail with many of the metrics
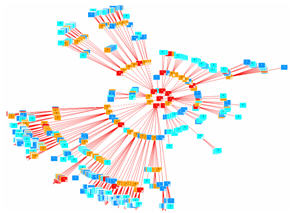
A map color-coded with the Hotspot Index, viewed from the “polar top” looking “down” the levels
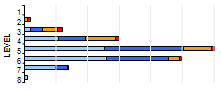
Hot positions can be found at all levels, but, generally, the higher the leader, the hotter the index, which accords with common sense. The unknown hubs, however, are deep in the org, sources of risk and opportunity